- Development of a new tool for the understanding of the reaction and degradation mechanisms of solid oxide fuel cells(SOFCs) and improvement in their performance -
Teruhisa Horita (Leader) and Taro Shimonosono (Research Scientist), Fuel Cell Materials Group, the Energy Technology Research Institute (Director: Yasuo Hasegawa) of the National Institute of Advanced Industrial Science and Technology (AIST; President: Tamotsu Nomakuchi), have developed a technology to freeze and visualize the ionization of oxygen and the diffusion of oxygen ions in the cell stack of a practical solid oxide fuel cell (SOFC).
This technology measures the concentration distribution of a label element, a stable oxygen isotope (18O), using secondary ion mass spectrometry (SIMS) with a high resolution of less than one micrometer. In this study, after the fuel cell reaction took place with the stable oxygen isotope (18O2) being introduced into the cell stack of a practical SOFC under high-temperature operation (using the intermediate-temperature cylindrical planar cell stack in A and B in the figure below), the stack was rapidly cooled to room temperature. The concentration distribution of the oxygen isotope was measured and oxygen-ionization active sites in the practical cell were visualized and identified (C and D in the figure below). This technology allows the identification of regions with high oxygen-ionization activity in the electrode and the electrolyte, as well as visualization of the concentration distribution of oxygen ions caused by the flow (diffusion) of oxygen ions. It is expected to contribute to design guidelines for high-performance electrode – electrolyte interfaces and to the elucidation of degradation mechanisms.
Details of this technology will be presented at the Asian SOFC Symposium to be held in Kyoto on September 5 to 7, 2010.
 |
|
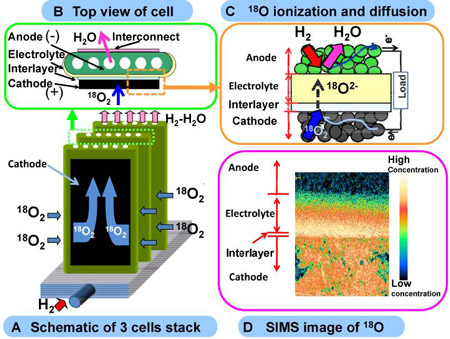
Figure : Example of the visualization of oxygen-ionization active sites and the concentration distribution of 18O in the cell stack of a practical SOFC |
In recent years, fuel cells, as highly efficient power-generation systems, are attracting attention. An SOFC, which operates at high temperatures (above 600 ºC), has the highest energy conversion efficiency (over 40%) among the various types of fuel cells. It is expected to be the next-generation stationary fuel cell and demonstration tests are being conducted. The SOFC is composed mainly of ceramics, i.e. solid materials. Oxygen molecules (O2) are ionized into oxygen ions (O2-). The oxygen ions diffuse through a solid electrolyte and react with hydrogen to generate electricity (C in Figure above).
In order to develop high-performance SOFCs, the reaction resistance caused by the ionization of oxygen and the diffusion of oxygen ions must be reduced. An indirect method, in which an electrode reaction mechanism model is assumed and the electrical signals are measured under different conditions, has been mainly used to estimate the movement of oxygen and oxygen ions. In practical SOFCs, it is difficult to directly visualize the regions with high oxygen-ionization activity and the concentration distribution of the oxygen ions caused by diffusion, and the realization of such visualization is expected.
In order to develop SOFC materials, AIST is conducting research to gain a comprehensive understanding of the ionization and diffusion of the reactant gas, and it has clarified the diffusion mechanism of oxygen by SIMS and other analysis techniques using an oxygen isotope as a label element. We are investigating the degradation mechanism of SOFC materials and developing a technique to predict the service lives of these materials by applying SIMS to the measurement of impurity concentrations. Using the SIMS technique in which we have considerable expertise, we have visualized the ionization of oxygen and the movement of oxygen ions in a practical cylindrical planar cell stack.
Part of this research was supported by "Development of System and Elemental Technology on Solid Oxide Fuel Cells (SOFC)" project (FY2008-2012) commissioned by the New Energy and Industrial Technology Development Organization.
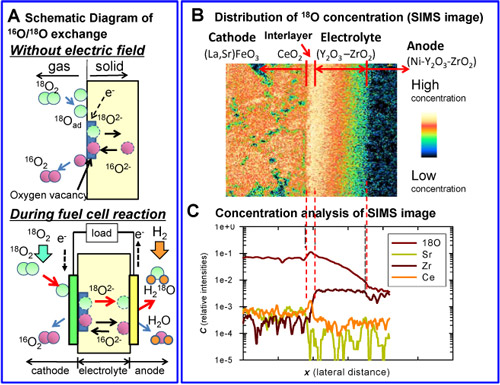
This technology is based on the oxygen isotope-labeling technique, which uses a stable oxygen isotope (18O) as a label element. When high concentration 18O2 is introduced into the cell stack at operating temperatures above 600 ºC, the 18O2 is adsorbed and dissociated into oxygen ions (18O2-) near oxygen vacancies on the surface of the solid and the ions enter the solid due to the difference in isotope concentrations. In this process, the same amount of 16O2- ions in the solid diffuse into the gas phase and isotope exchange proceeds (top in Fig. 1 A). During the fuel-cell reaction, 18O2 in the gas phase is taken into the solid by power generation (bottom in Fig. 1 A). The amount of oxygen taken into the solid is proportional to the amount of ionized oxygen and the current density, allowing the identification of regions with high oxygen-ionization activity and the estimation of current density distribution in the power generation cell.
In this research, high concentration (92% volumetric concentration) 18O2 was introduced into the cell stack of a commercial SOFC system (Kyocera's cylindrical planner cell stack) operating at a high temperature (650 ºC). The oxygen isotope (18O2) was introduced into the cell stack for 300 s at a stack voltage of 1.622 V and an average current density of 0.25 A/cm2, and then the cell stack was rapidly cooled to room temperature. The concentration distribution of 18O in the cell stack was measured by SIMS with a high resolution of less than one micrometer. Oxygen ionization active sites and the distribution of oxygen ions were visualized for the first time in a commercial SOFC system.
Figure 1 (B and C) shows the concentration distribution of 18O in the air electrode – interlayer – electrolyte interface region of the power generation cell. The 18O concentration is the highest in the interlayer region, indicating active ionization of oxygen (O2 + 4e- → 2O2-) in this region. The 18O concentration in the interlayer – electrolyte interface is discontinuous (Fig. 1 C), indicating non-smooth diffusion of oxygen ions into the electrolyte.
 |
|
Figure 1 : (A) oxygen isotope-exchange reaction, (B) 18O distribution measured by SIMS, (C) 18O concentration analysis of SIMS image |
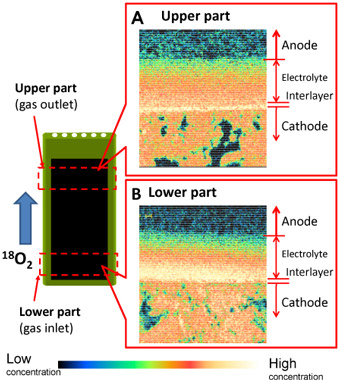
One outer cell in the three-cell stack was removed and the 18O concentration distribution was measured to estimate the current distribution in the cell stack. Figure 2 shows the results. The 18O concentration in the electrolyte is high in the gas inlet region (Fig. 2 B) and low in the gas outlet region (Fig. 2 A). This is probably due to the difference in current distribution between the upper and lower parts of the cell, despite the fact that they are electrically connected within a single cell.
 |
|
Figure 2 : Difference in 18O concentration in one cell: the 18O concentration in the electrolyte is higher at the lower part (the gas inlet region) than at the upper part (the gas outlet region), suggesting that there is a higher current density at the lower part. |
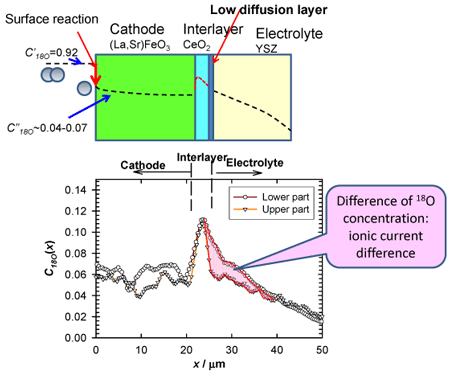
Figure 3 compares the 18O concentration in the air electrode – interlayer – electrolyte region at the upper and lower parts of the cell, focusing on part of the 18O concentration distribution in Fig. 2. The 18O concentration is the highest in the interlayer, suggesting active ionization of oxygen in this layer. The 18O concentration in the interlayer is the same at the upper and lower parts of the cell, whereas that in the electrolyte is higher at the lower part than at the upper part, as shown by the SIMS image. This suggests that the current density is higher at the bottom of the cell. The 18O concentration in the interlayer – electrolyte interface is stepped and discontinuous. This shows that 18O2- ions do not diffuse smoothly, suggesting the presence of a low diffusion layer in the interlayer – electrolyte interface region. The flow distribution of oxygen ions in a practical cell has been visualized for the first time by using this technology.
 |
|
Figure 3 : Comparison of the concentration distribution of the stable oxygen isotope (18O) at the gas inlet (bottom of the cell) and outlet (top of the cell) regions
|
The next steps in this research are to measure the concentration distribution of oxygen ions in a cell stack operated under different conditions; to identify the mechanism of resistance generation resulting from the ionization of oxygen; and to present design guidelines for high-performance electrode – electrolyte interfaces. Measurements of the cell after a long period of operation will be made to provide information leading to identification of the degraded regions and an understanding of the degradation mechanism.